Convergence Tools: Brillouin Zone sampling#

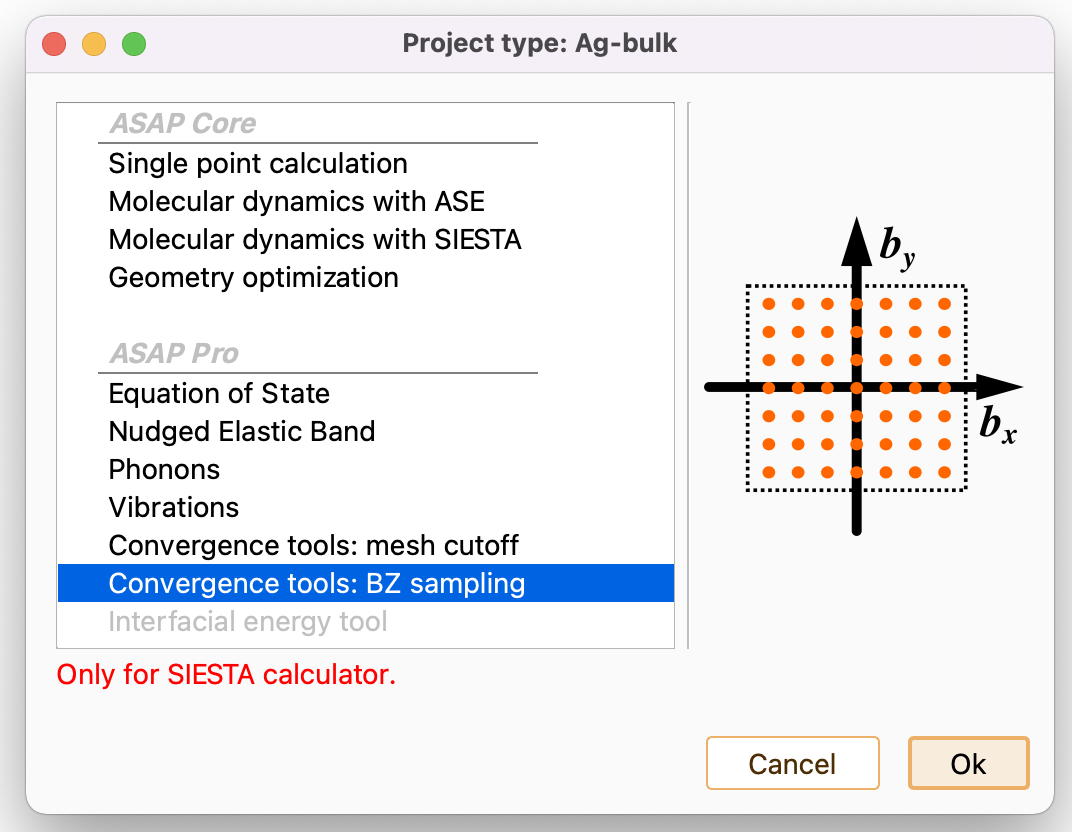
Then click on the Parameters icon to open the Convergence tools: BZ sampling parameters widget.


On the right side of the Parameter widget, you can see the Monkhorst-Pack grid that will be used for each of the single-point calculations. You can modify the BZ sampling by tuning the following parameters:
Monkhorst-Pack grid. Initial Monkhorst-Pack grid.
ASAP also indicates the corresponding k-grid cutoff, a parameter determining the fineness of the k-grid used for Brillouin zone sampling. The k-grid cutoff is half the length of the smallest lattice vector of the supercell required to obtain the same sampling precision with a single k point.
Scaling of Monkhorst-Pack grid. The minimum (initial) and maximum (final) scaling applied to the MP grid previously indicated.
Number of grids. To indicate the total number of grids to be created.
Type of grids. To indicate if you desire to include only even or odd Monkhorst-Pack grids.
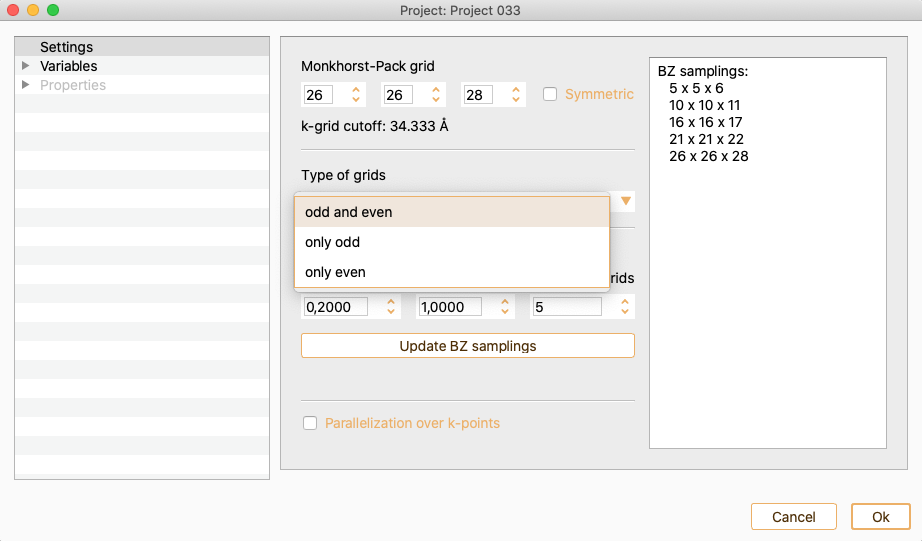
Press the Update BZ samplings button to update the list of grids displayed in the right side of the Parameter widget.


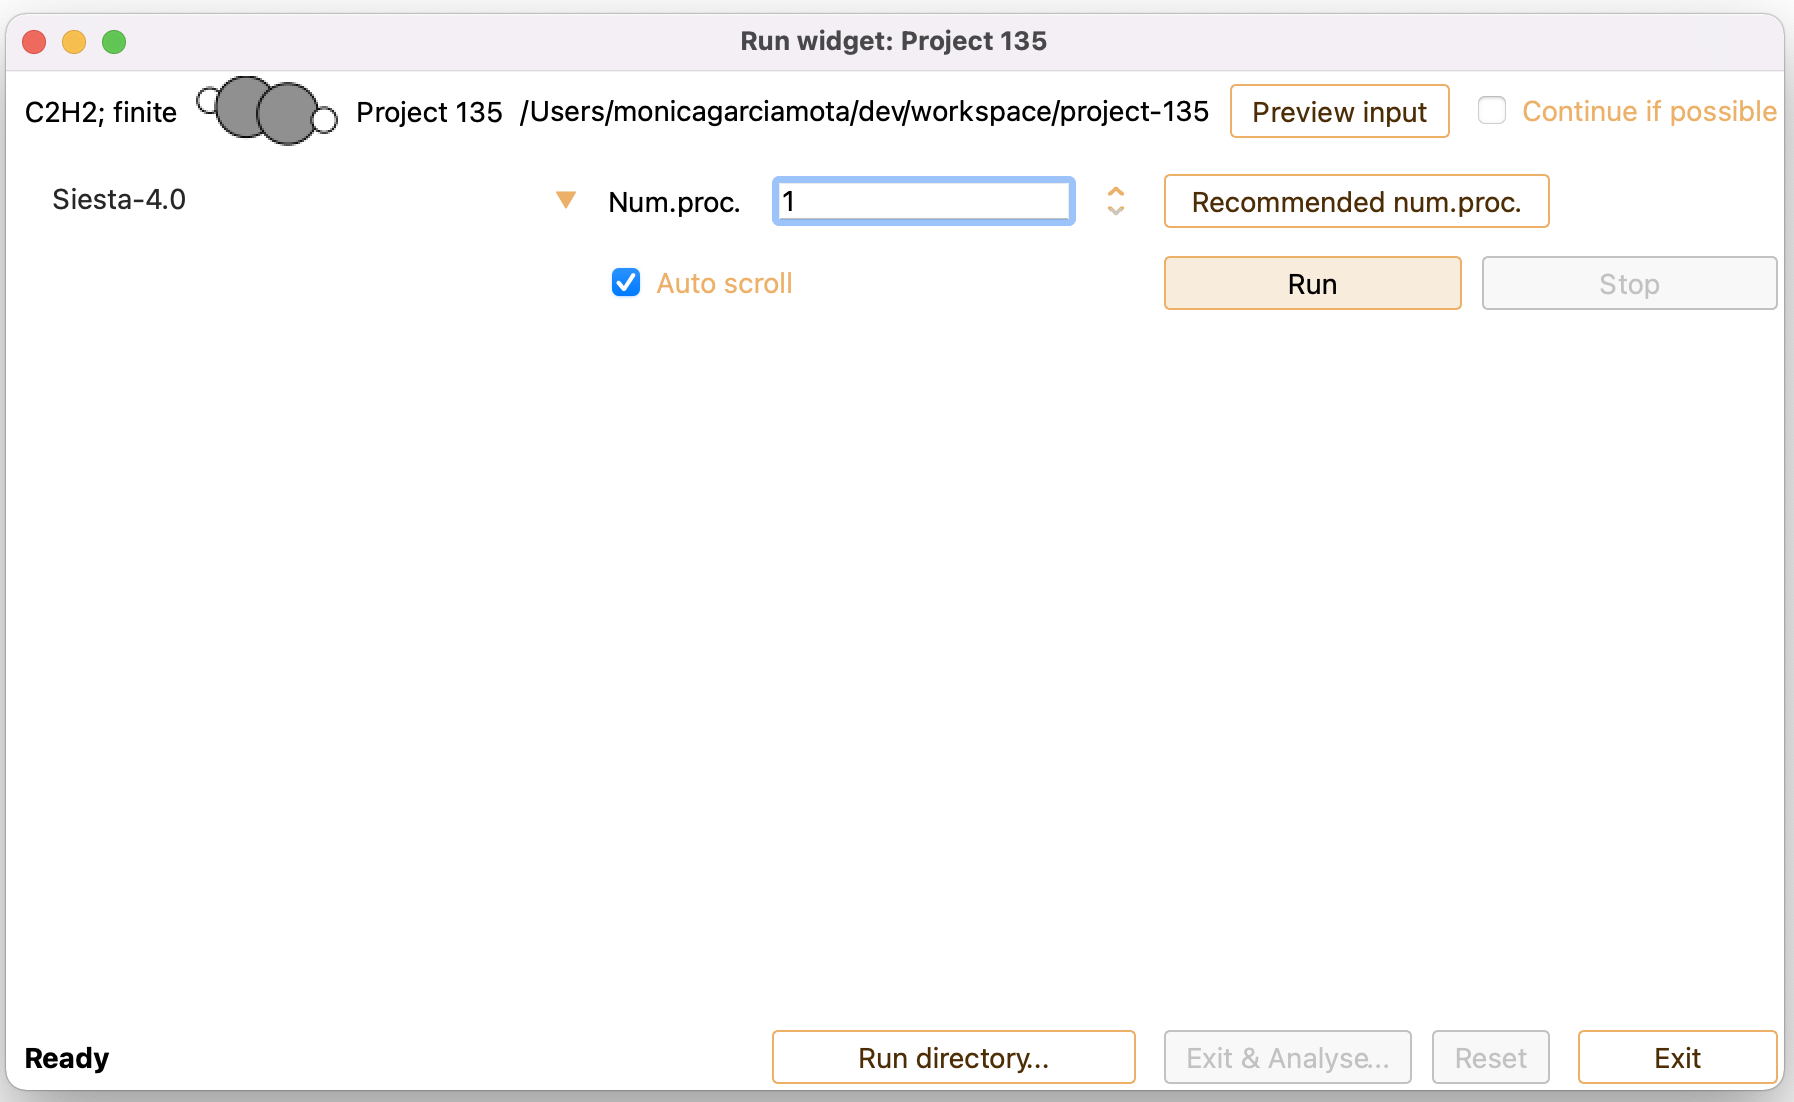

In addition, the Task output tab in the Run widget shows relevant information of Geometry optimisation output in real-time.
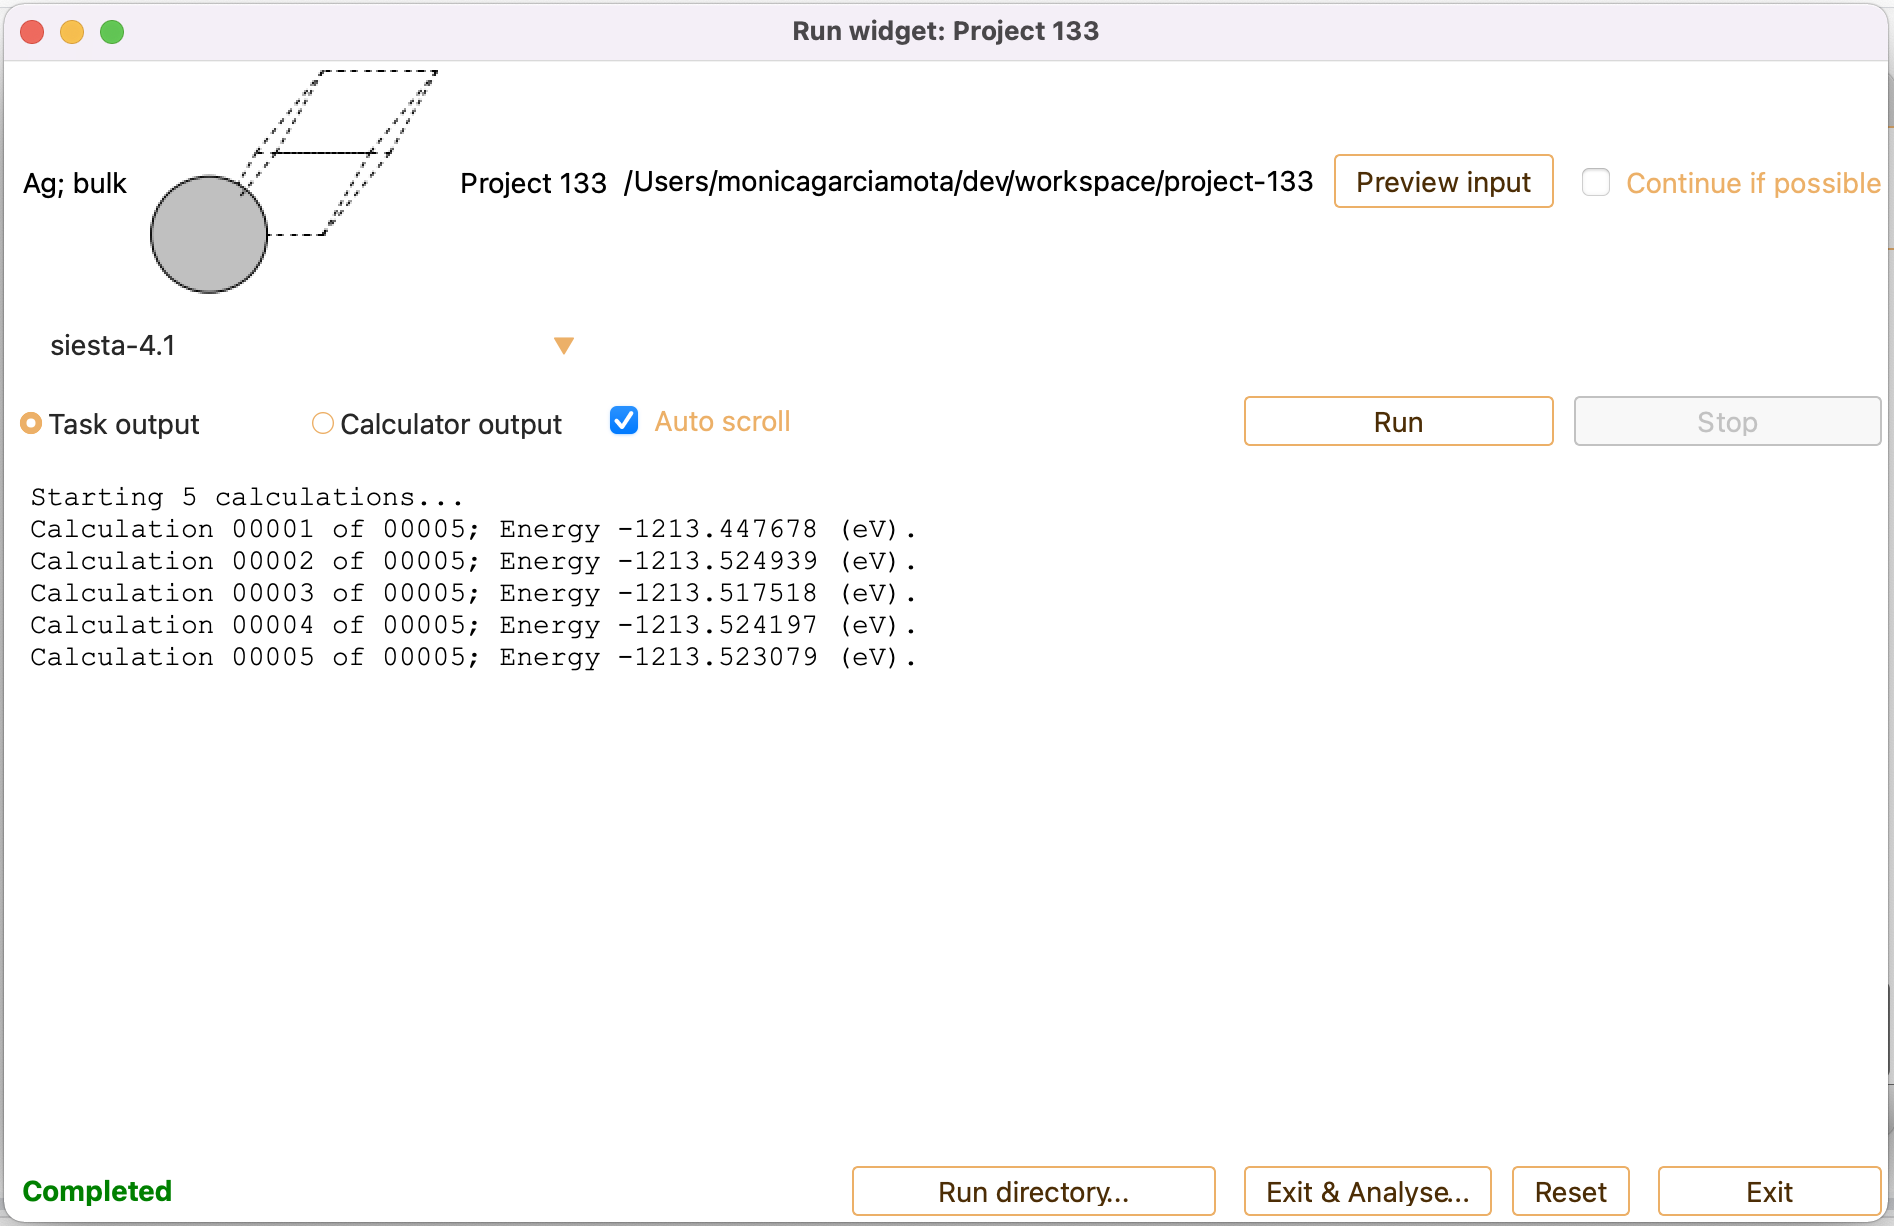
Convergence Tools. Brillouin Zone sampling workflow: Analysis#
When the calculation is completed, select Exit and analyse to open the analysis widget.

Select one of the Plot type options to visualise the energy deviation, maximal force deviation or Frobenius norm of stress deviation computed for each of the used Brillouin zone (BZ) sampling grids. Each deviation is computed using the corresponding value obtained with the highest BZ sampling grid.
